

usage_read scope, which every role holds. Every figure comes from the same usage routes your code can call, listed at the end of this page.
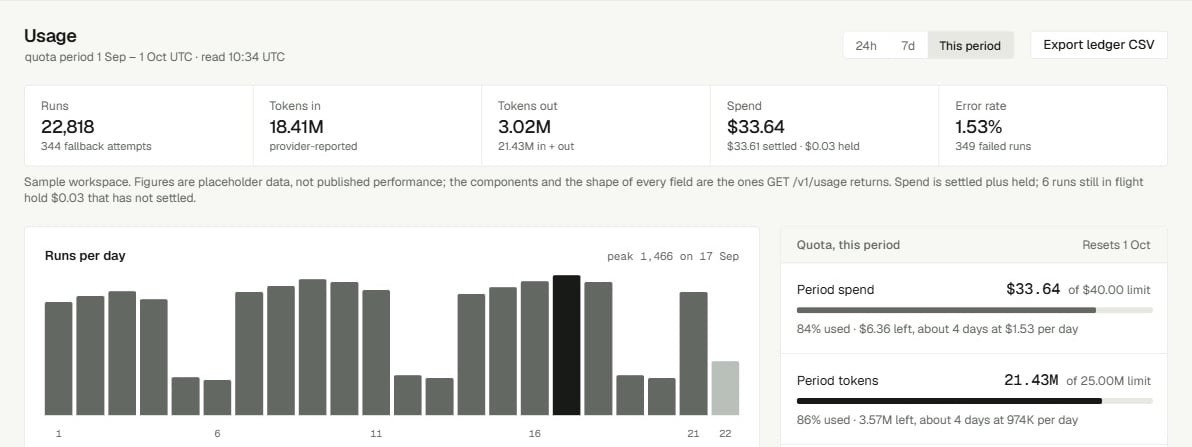
Usage with sample figures
Pick a range
The range tabs in the header are 24h, 7d and 30d; 30d is the default. Ranges count whole UTC days up to now:
The line under the title states the exact window, for example last 7d · 2026-09-18 to 2026-09-24 14:05 UTC · counted from settled accounting rows. The range applies to the totals, the chart, spend by model and the request log. It does not apply to Quota, this period, which always covers the current calendar month.
Totals
Five figures sit across the top.
Amounts under a cent show four decimals, such as
$0.0019, so small spend does not read as $0.00. A single decision run can cost less than 0.0000`. See Models and pricing for the price per token.
Runs per day
Runs per day has one bar per UTC day in the range, scaled to the busiest day; its meta shows that peak, such aspeak 214 · UTC. Hover a bar to see its date, its run count and its spend. Days with no runs are drawn flat rather than skipped. The last bar is today, labelled partial because the day is not over.
Spend by model
Spend by model groups the request log by model. It has one row today: Neon 1.1, served by OpenType.
Its meta says what it is built from, such as
from the last 200 attempts: it adds up the same rows as the request log, so in a busy range it covers the newest 200 calls rather than the whole range. The Spend total at the top always covers the whole range.
Quota, this period
Quota, this period shows where the organization stands against its limits for the current quota period, the calendar month in UTC. Its meta shows when the period ends, such asresets 2026-10-01.
The panel reads the same figures the API checks when it admits a run, so this panel and a refusal never disagree. When a run would pass the period’s spend or token limit,
POST /v1/runs refuses it with 429 organization_spend_quota_exhausted or 429 organization_token_quota_exhausted, before anything is read or charged. The limits reset at the start of the next period. See Spend limits and quotas.
The same period spend appears in the sidebar as Spend this period, against the cap.
Request log
The Request log has one row per model call, newest first, from an append-only record: rows are added, never changed. It shows the newest 200 calls in the range; the count above it reads, for example,37 of 200 attempts. A run usually makes one call; a run that was retried has one row per attempt.
Filter the log
The filter bar above the log narrows the rows already loaded:- Run ID: a search box (placeholder
run_…) that matches any part of the run ID. - Status:
Status: any, or a status from the rows loaded, such asfailed. - Model:
Model: any, orNeon 1.1.
A new organization
Until the organization has run anything in the range, the totals are replaced by No usage recorded yet: Usage is written when a run settles. Send a request from the Playground or with an API key and this page fills in. Choose Open the Playground to run one.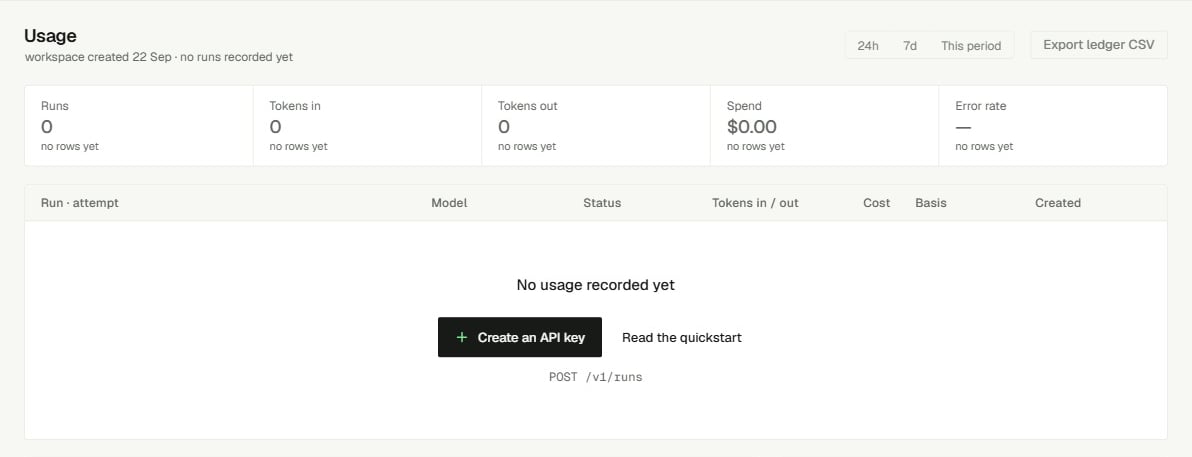
Usage before the first run
When figures are missing
The page never shows a figure it could not read as zero.Read the same figures from code
Each panel is one API route, and all of them needusage_read. A key created with the Read only set on API keys has it.
Windows are UTC timestamps in exactly the form
2026-09-01T00:00:00Z, sent together or not at all. Leaving both out means the current quota period.
GET /v1/usage answers with the figures behind the totals. Money is integer micro-USD: 1,000,000 is $1.
Related
- Usage reporting - every usage route, its fields, and how to build your own reports.
- Spend limits and quotas - the period limits, the per-request ceiling, and the 429 refusals.
- Billing - the balance that each run’s cost is charged against.
- Models and pricing - the price per token behind every Cost figure.
- Request IDs - tie a row in the log to the request your code sent.